
RiLiFi organization analytics: team usage, people and licenses
Organization analytics shows owners and admins how the team uses RiLiFi. You see how many sessions members run, how many people join them and which licenses sit unused. It shows counts only. Answers, attendee names and the names of presentations or quizzes stay in each member's own reports.
Open organization analytics
Each number compares with the period just before it. If your organization did not exist for the whole of that earlier period, the card shows New org instead of a change.
The chips under the bar hide or show each activity on Pulse and People. Updated shows when the numbers were read, and the refresh button reads them again.
For meetups or user groups in many cities, see how tech communities use organization analytics for every chapter.
- Open Organization in the sidebar, or Organization setup in the account menu. If you have no organization yet, start with organizations and licenses.
- Press the Analytics tab.
- Pick a view: Pulse, People or Activities. Then pick a period: 30 d, 90 d or 12 m.
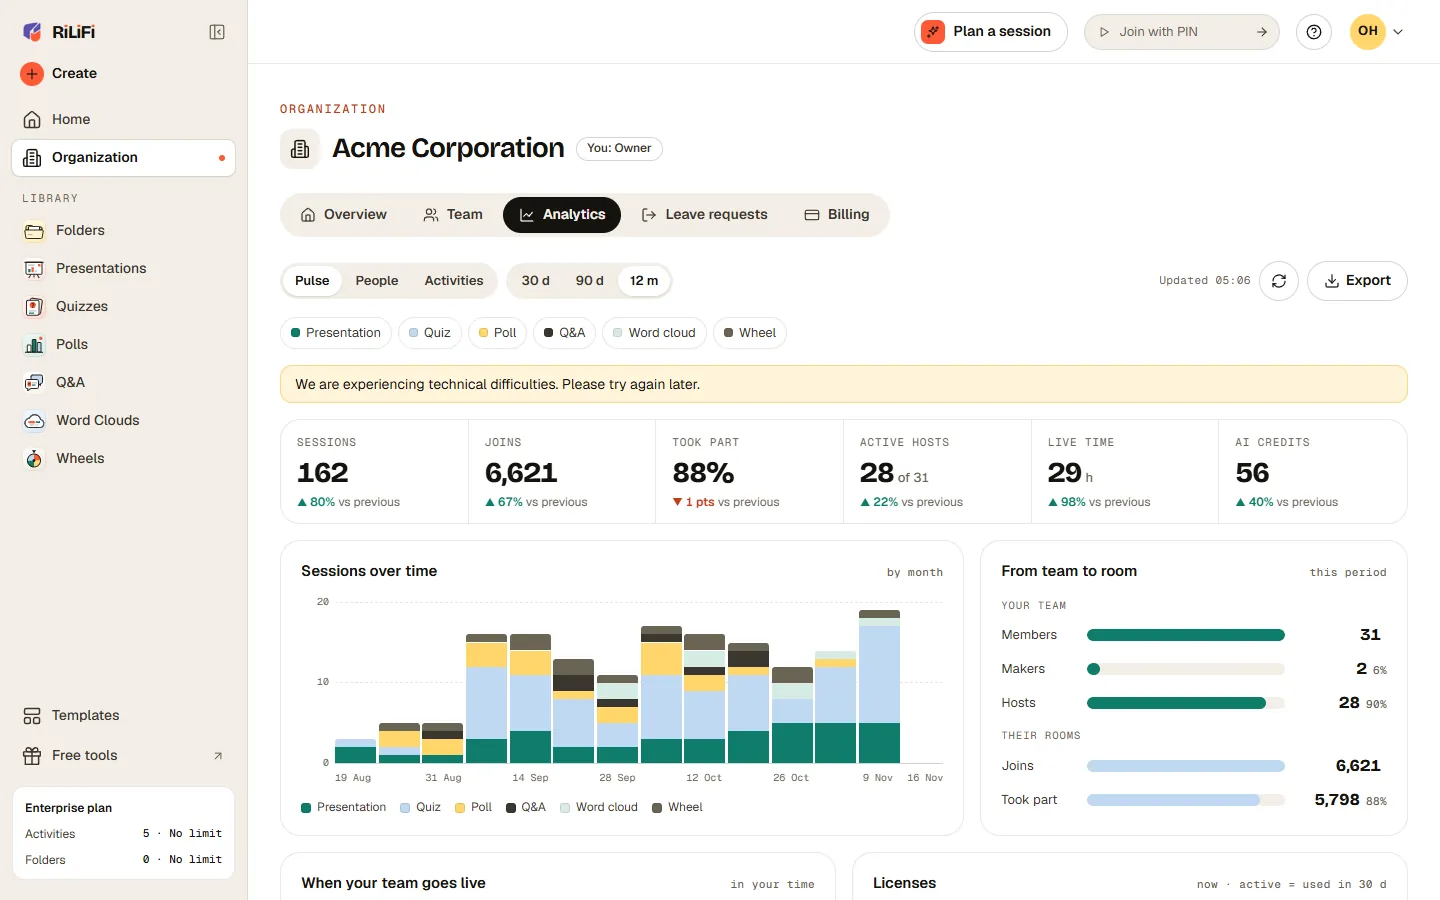
Pulse: the team at a glance
Six numbers sit at the top of Pulse.
| Number | What it counts | Good to know |
|---|---|---|
| Sessions | Live sessions your members ran and ended | Each run counts once, whatever its size. |
| Joins | People who joined, added up per session | One person in two sessions counts twice. |
| Took part | Share of joins who answered, voted or asked something | Wheels have no answers, so they are left out. |
| Active hosts | Members who went live at least once | Shown out of all members, such as 28 of 31. |
| Live time | Hours of live sessions | Only the activities the chips show. |
| AI credits | AI credits members used | The activity chips do not change it. See AI credits. |
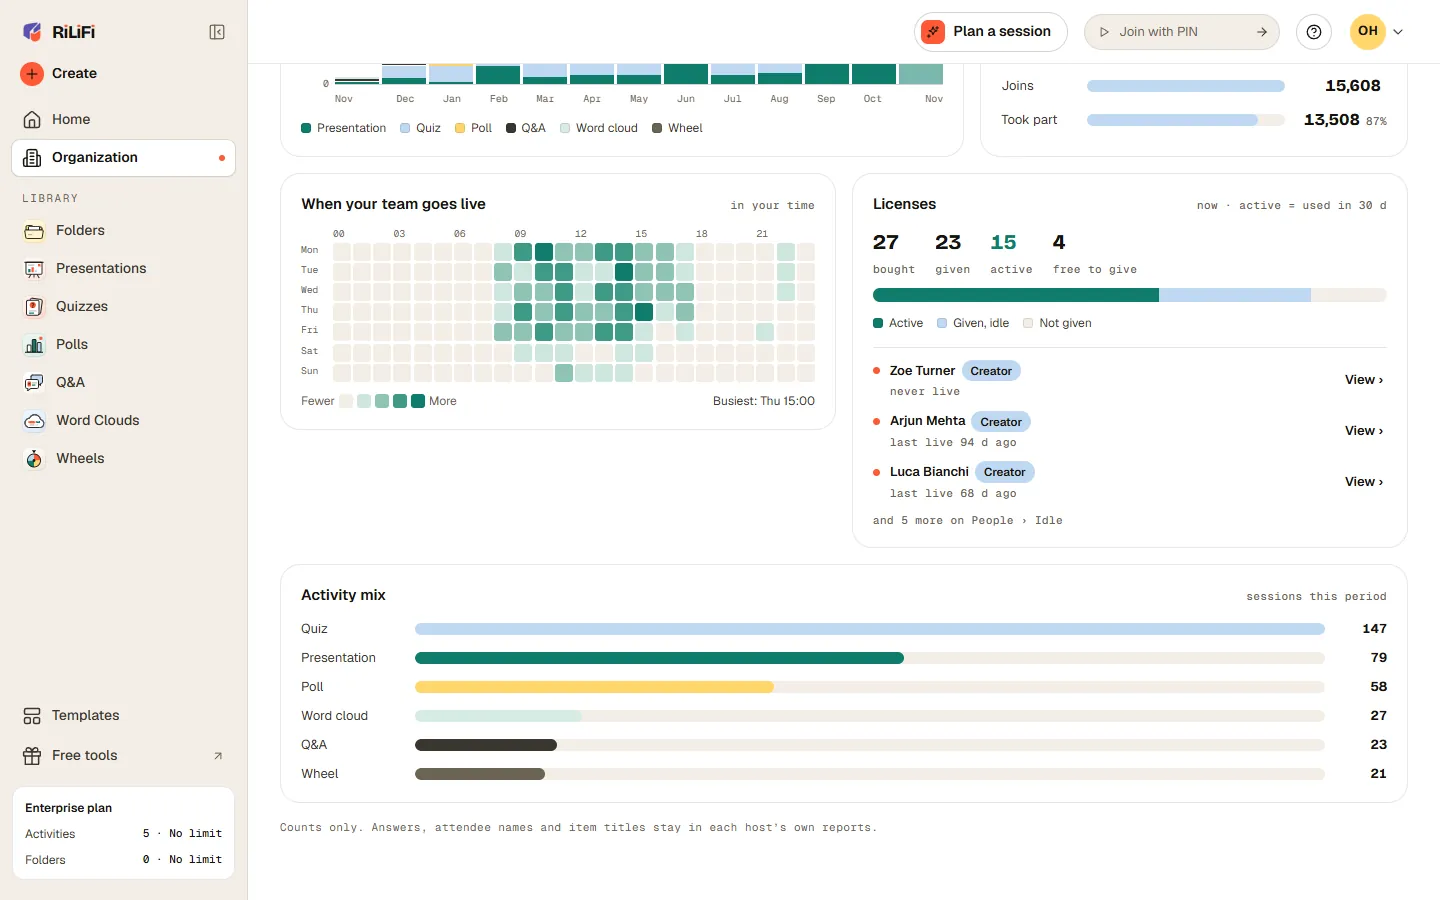
Pulse charts
- Sessions over time stacks each activity by day (30 d), by week (90 d) or by month (12 m).
- From team to room runs from members to makers (people who made something) and hosts, then to joins and took part.
- When your team goes live maps sessions by weekday and hour, in your own time zone, and names the busiest hour.
- Licenses shows your licenses as they are today, whatever the period: bought, given, active and free to give. A license is active when its holder went live or made something in the last 30 days. The 3 holders idle the longest get View, and the rest are under People, Idle.
- Activity mix splits the period's sessions by activity.
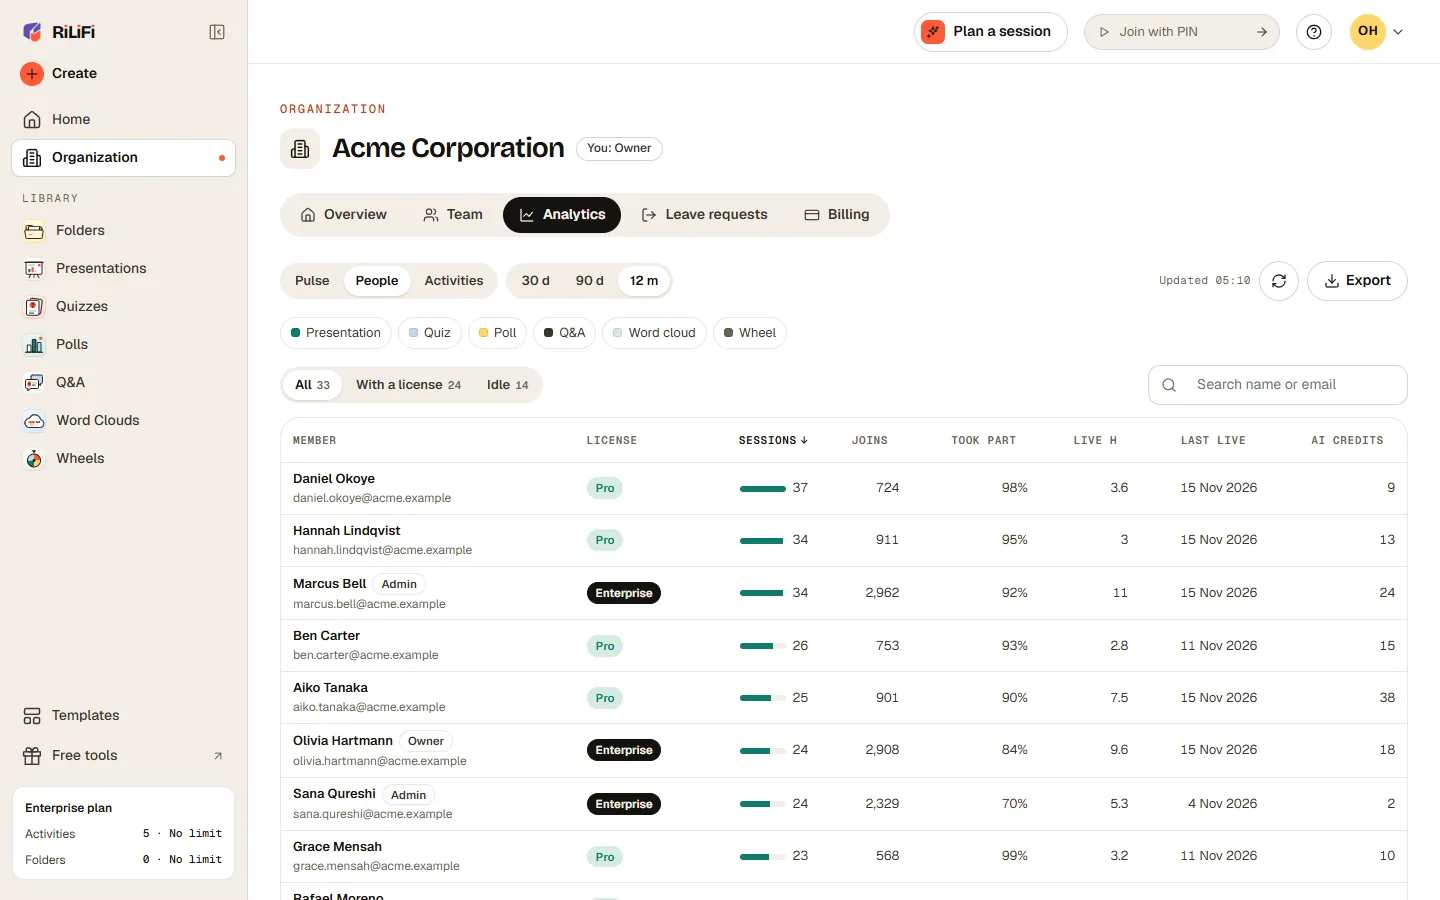
People: one row per member
People lists everyone who was a member during the period. Filter by All, With a license or Idle. Idle means no session and nothing made in the last 30 days.
- The columns are Member, License, Sessions, Joins, Took part, Live h, Last live and AI credits. Press a column to sort by it.
- Search by name or email. The list shows 50 people at a time, with Show 50 more below.
- The owner and admins carry a badge. Someone who left shows Left and the date, and counts for the time they were in.
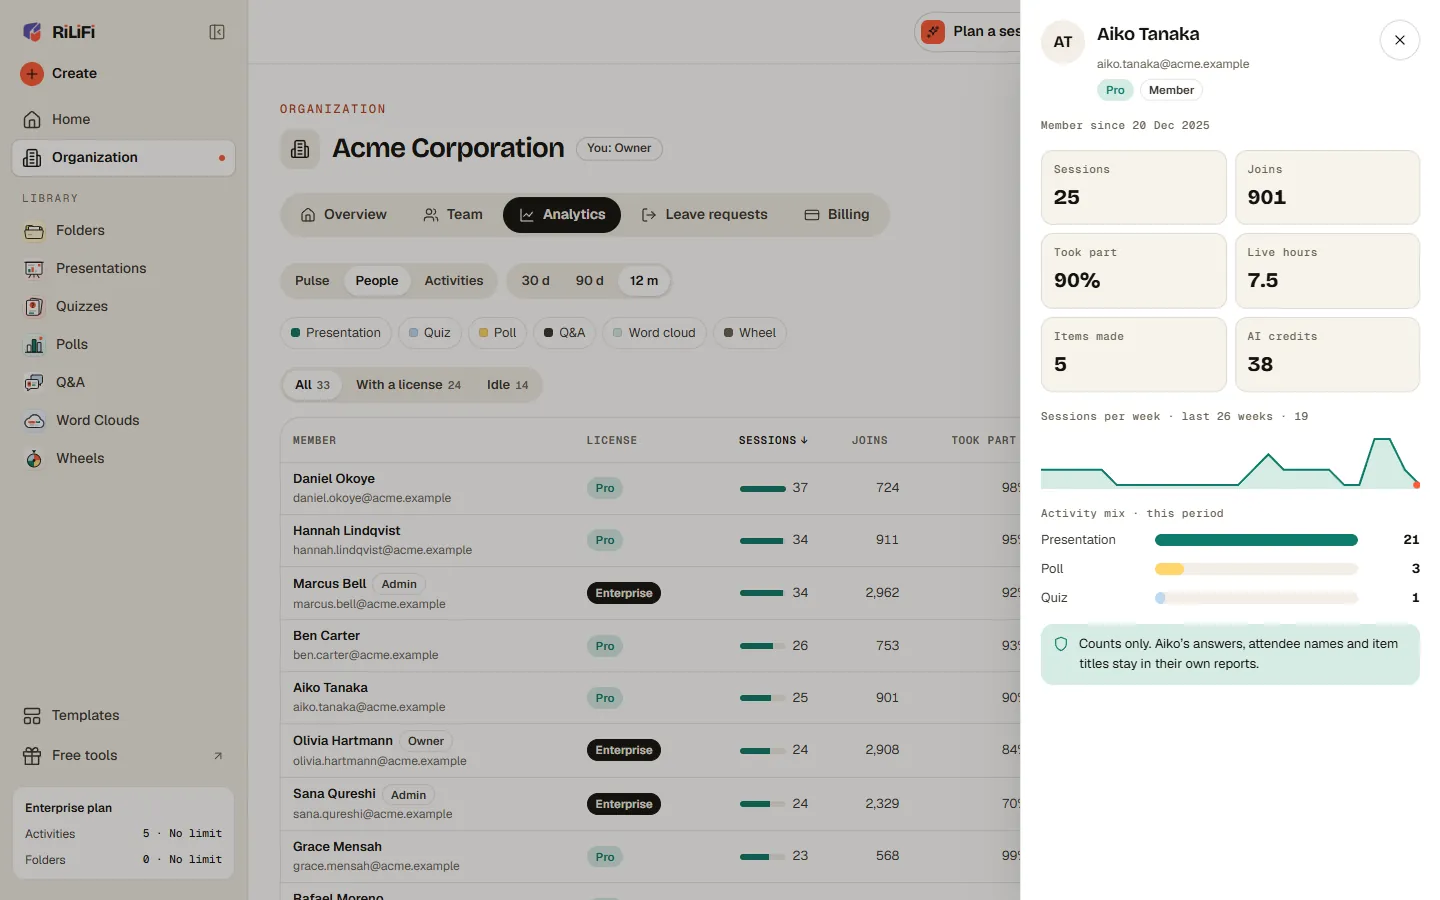
A member's sheet
Press a row on People, View on the Licenses card or a host's name on Activities to open that member's sheet. It shows when they joined and six totals: sessions, joins, took part, live hours, items made and AI credits.
Below the totals are their sessions per week for the last 26 weeks and their activity mix for the period.
Activities: each activity on its own
Activities gives each activity a card with its sessions, joins, one rate and its top 3 hosts. Pulse on a card opens Pulse with only that activity shown. Press a host's name to open their sheet.
| Activity | Rate on the card | What it means |
|---|---|---|
| Presentation | Slides answered | Question slides that got at least one answer, out of those shown. |
| Quiz | Accuracy | Right answers out of every answer given. |
| Poll | Took part | Joins who voted. |
| Q&A | Answered | Questions answered out of those put on screen. |
| Word cloud | Words each | Words sent per person who took part. |
| Wheel | Spins | Spins in the period. Wheels have no joins. |
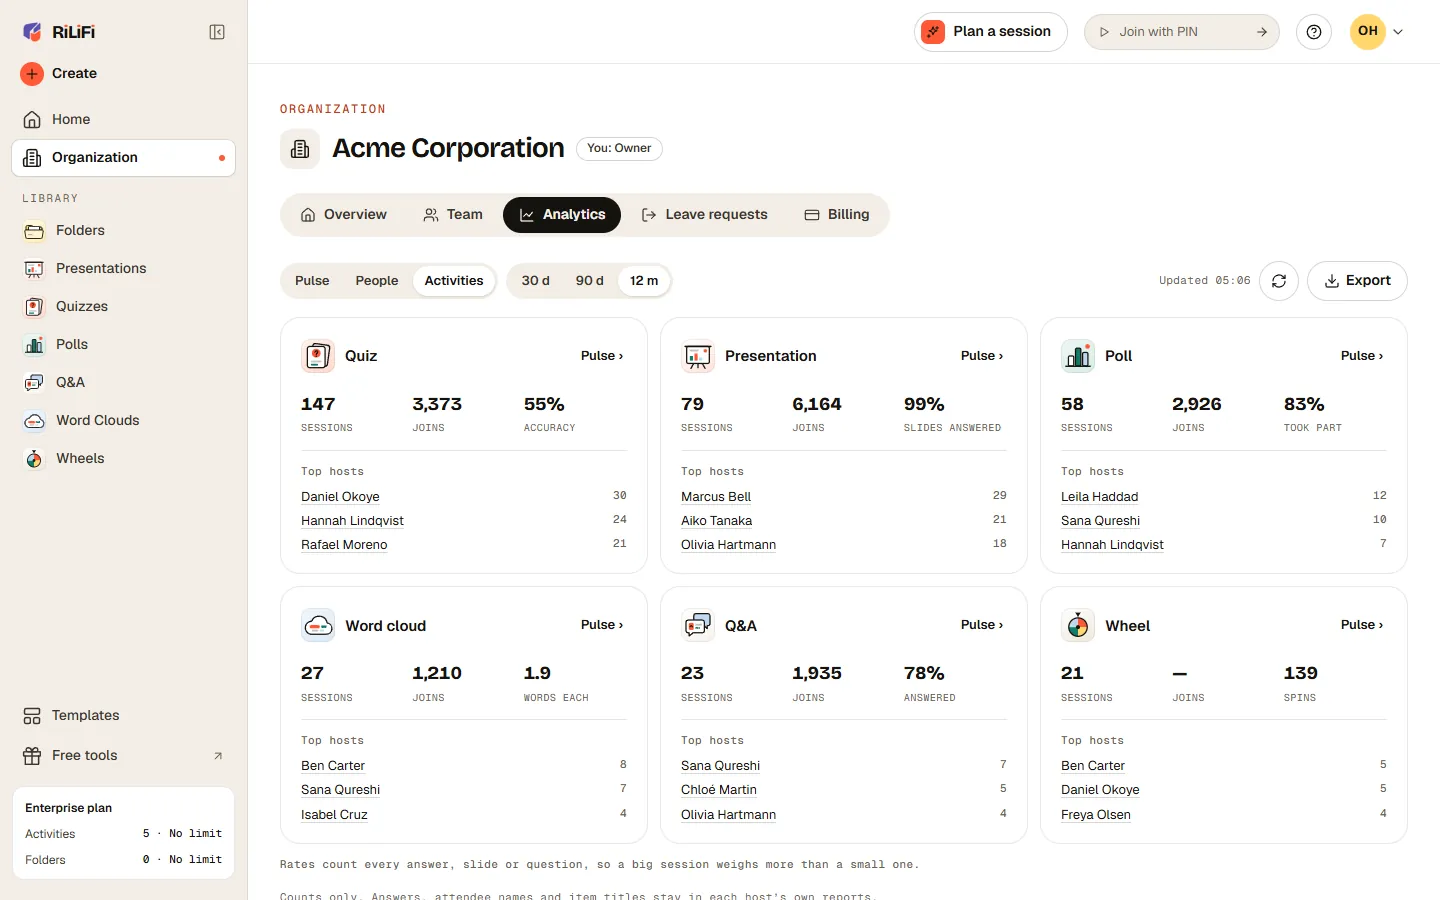
Note:Rates count every answer, slide or question, so a big session weighs more than a small one.
Export
Press Export in the bar. Both files cover the period on screen and the activities the chips show. They hold counts only, and they list every member whatever the People filter or search.
- People (CSV): one row per member with name, email, role, license, sessions, joins, took part, live hours, last live date and AI credits.
- People + sessions per day (Excel): the same People sheet, plus a sheet with sessions per day for each activity, in your time zone.
What counts
- Only time in the organization. A member's sessions count from the day they joined until the day they left. Sessions from before or after stay out.
- Ended sessions only. A live session counts a few minutes after it ends.
- Deleted work is left out. A deleted session, item or folder stops counting, so totals match each member's own reports.
- Counts only. No answers, attendee names or item titles. The names and emails you see are the ones admins already see on Team.
What members see
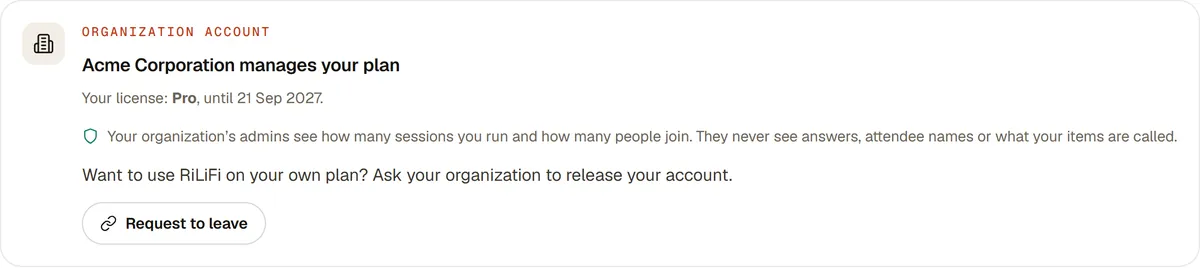
Only the owner and admins see the Analytics tab. Members see a note about it on their Manage subscription page. It tells them admins see how many sessions they run and how many people join. Admins never see their answers, attendee names or item titles.
Common questions
Can RiLiFi organization admins see answers or attendee names?
Which RiLiFi plan includes organization analytics?
Do members know their usage shows in organization analytics?
Does organization analytics count sessions from before someone joined?
What happens to RiLiFi organization analytics if the owner's Enterprise plan ends?
Can I export RiLiFi organization analytics?
Was this article helpful?
Screenshots show the RiLiFi app as of 15 Nov 2026, with demo content.
Still stuck? Raise a support case from your account, or email hello@rilifi.com with what you were trying to do.