RiLiFi
Start free

Session reports

Quiz results and session reports you can export.

Every quiz, poll, Q&A, word cloud, wheel and presentation you run gets its own report. Open it after the event to see scores, votes and questions. Download it as CSV or Excel on Creator, Pro and Enterprise.

  • A report for every session
  • Who answered what
  • CSV, Excel and PDF
one click to CSV
Session archiveQ3 all-hands · Sales kickoff · Sep 18
Participants
1,284
Avg. score
72%
Questions
12
Avg. time
9.4s
Score distribution
Leaderboard
#NameScoreAccuracy
1Aiko Tanaka118100%
2Femi Adeyemi11292%
3Priya Raman10992%
4Tomás Ruiz9783%
6
activity types, each with its own report
5 bands
quiz score chart, from 0–20% to 81–100%
3 formats
Excel, CSV and PDF from a presentation report
Free
to view every report. Downloads from Creator.
Session archiveQ3 all-hands · Sales kickoff · Sep 18
Participants
1,284
Avg. score
72%
Questions
12
Avg. time
9.4s
Score distribution
Leaderboard
#NameScoreAccuracy
1Aiko Tanaka118100%
2Femi Adeyemi11292%
3Priya Raman10992%
4Tomás Ruiz9783%
01

Quiz results, player by player.

A quiz report opens with four numbers: participants, average score, questions and average completion time. A chart sorts the players into five score bands. The leaderboard ranks everyone by points, and players on the same points are ranked by speed.

  • LeaderboardRank, name, score and correct answers for every player.
  • Each player’s answersOpen a player to see each answer next to the right one, with points. On Creator, Pro and Enterprise.
  • Three CSV filesThe session overview, the leaderboard and every player’s answers.
Download reportSaved
  • ExcelSummary, people, leaderboard, Q&A.xlsx
  • CSVAll results in one list.csv
  • PDFFrom the print dialog.pdf
02

Every slide of a presentation, with its results.

When an interactive presentation ends, its report draws each slide again with the final results and how many people answered. The leaderboard, the Q&A questions and the wheel picks sit below the slides.

  • Excel workbookSheets for the summary, each person’s answer per slide, the leaderboard, Q&A and wheel picks.
  • CSVAll the results in one list.
  • PDFPrint the report, or save it as a PDF from the print dialog.
Live Q&AAnonymous4 questions
  1. Will the hybrid policy change next year?
  2. How are we measuring the new onboarding?
  3. Can we get the slides after the session?
  4. What is the plan for the Berlin office?
rilifi.com/joinPIN 482 913
03

Polls, Q&A and word clouds keep a record too.

Each activity’s report shows what the room did, in that activity’s own terms. Spinning wheel sessions list every winner with the option won and the time.

  • PollVotes and percent for each option, and who chose what in a named poll.
  • Q&AUpvotes, answered or not, edits next to the original text, and a moderation log.
  • Word cloudEvery word with its count, the final cloud, and a PNG picture of it.
Reports by planSaved
  • FreeView every report$0
  • CreatorDownloads and named results$7/mo
  • EnterpriseVerified people in the reportLogin only
04

What each plan includes.

Every plan, Free included, keeps a report for each session and shows it on screen. Creator, Pro and Enterprise add the downloads and the per-person answers.

  • FreeEvery report on screen: the numbers, charts and final results.
  • Creator and upCSV, Excel, PDF and PNG downloads, plus who answered what. From $7 a month.
  • EnterpriseLogin-only sessions add a list of verified people, with names and emails.
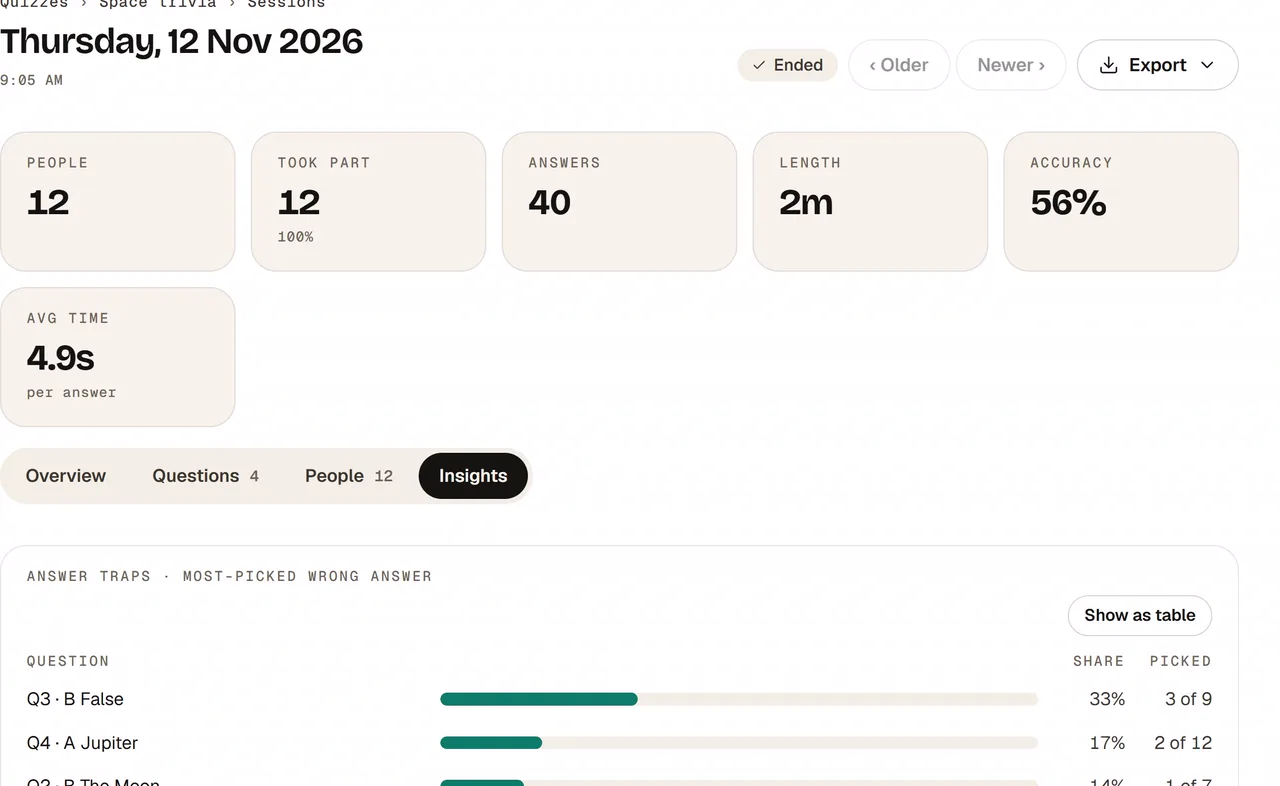
The Insights tab of a quiz report: answer traps, the wrong answers people picked most on each question
05 · Advanced Analytics & Reporting SuiteNew

Compare sessions, see the patterns.

Advanced Engagement Insights is part of the Advanced Analytics & Reporting Suite. Every session report gets an Insights tab, and each quiz, poll, word cloud, Q&A, wheel and presentation gets an Insights page that puts its sessions side by side. It is on Pro and Enterprise.

  • An Insights tab on every reportFor a quiz: the wrong answers that trapped people, speed against accuracy, how the lead changed and where people dropped off.
  • Sessions side by sideYour 12 latest sessions in one view, over all time, 12 months, 90 days or 30 days. For a quiz, the share right on each question.
  • Built on your session reportsThey stay as they are. The comparison downloads as CSV.
See Pro and Enterprise pricing →
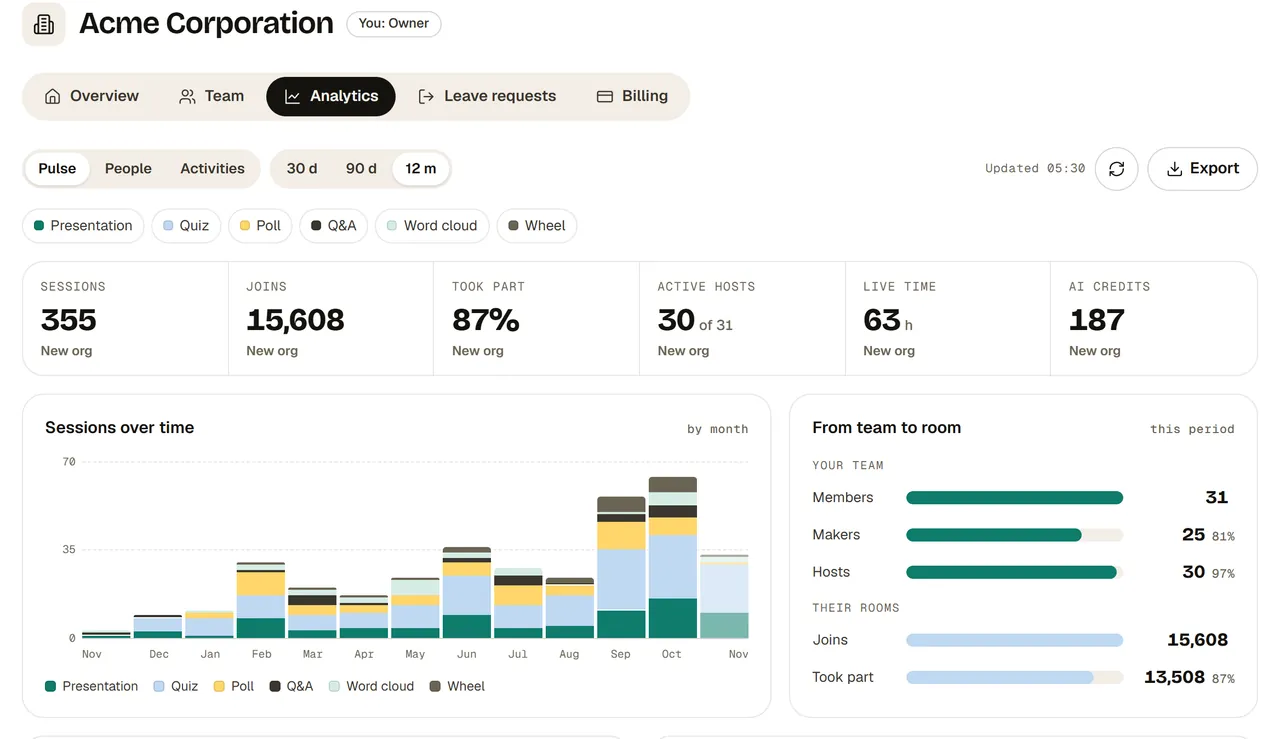
Organization analytics for a team of 31: sessions, joins, took part, active hosts, live time and AI credits over 12 months, sessions by month and the team-to-room funnel
06 · Organization analytics, on Enterprise

See how your whole team uses RiLiFi.

An Enterprise organization gets an Analytics tab for its owner and admins. It counts the sessions your members run, the people who join and the share who take part, over 30 days, 90 days or 12 months. It shows counts only. Answers, attendee names and the names of presentations or quizzes stay in each member’s own reports.

  • PulseSessions, joins, took part, active hosts, live time and AI credits, each against the period before.
  • People and licensesOne row per member, and the license holders who have not used RiLiFi in 30 days.
  • CSV and ExcelExport people and sessions per day for your own reports.
How organization analytics works →

Report by report

What each report shows

  • Live quiz

    Participants, average score, questions and average completion time. Five score bands, the leaderboard and each player’s answers.

  • Live poll

    How many people joined and voted, votes and percent per option, and who chose what. CSV for multiple-choice polls.

  • Live Q&A

    People, questions asked, questions answered and upvotes. Filter by answered, not answered or not shown.

  • Word cloud

    People, responses, different words and hidden words, with a list sorted by count. CSV and PNG.

  • Spinning wheel

    Number of spins and every winner, with the option won and the time. CSV winner list.

  • Interactive presentation

    Each slide with its results, the leaderboard, Q&A and wheel picks. Excel, CSV and PDF.

FAQ

Session report questions

Can I export quiz results to Excel or CSV?
Yes, on Creator, Pro and Enterprise. A quiz report downloads as an Excel workbook or as CSV files, with every player’s answers. Both open in Excel and Google Sheets. Every other report downloads the same way.
Can I see individual answers in RiLiFi?
Yes, for named sessions on Creator, Pro and Enterprise. Open a player in the quiz report to see each answer next to the right one. Anonymous polls stay anonymous.
What can I see on the free plan?
Every report, on screen: the numbers, charts and final results of each session. Downloads and per-person answers start on Creator.
Where do I find an old report?
Open the quiz, poll or presentation and go to its session history. Each finished session is listed with its date, and its report opens from there.
Can I compare results across events or teams?
You can compare sessions, on Pro and Enterprise. Advanced Engagement Insights, part of the Advanced Analytics & Reporting Suite, gives each activity an Insights page with its 12 latest sessions side by side. For a quiz, that is the share right on each question. On Enterprise, organization analytics also lists every member’s sessions, joins and took part. It compares how people use RiLiFi, not their answers.
Does RiLiFi measure event ROI or an engagement score?
Not as one score. Every report shows who joined, who took part and how they did, and on Pro and Enterprise the Insights tab adds where people dropped off and which answers trapped them. Use those numbers in your own ROI report.
Can I save a report as a PDF?
Yes, every report, on Creator, Pro and Enterprise. Press PDF on the report and choose Save as PDF in the print dialog. A word cloud also downloads as a PNG picture.

Start free

Run a session. Keep the results.

Free for up to 100 participants per session. Monthly billing when you grow.

Start freeSee pricing

No credit card required