RiLiFi
Start free

Free guide · Examples to copy · Ready questions

Likert scale: examples and how to use it

A Likert scale is a set of statements or questions that people answer by choosing one point on a scale, such as Strongly disagree to Strongly agree. Below are labelled examples you can copy, 25 ready Likert scale questions for training, work, events, classes and meetings, and a plain guide to reading the results. You can also run one live, with everyone answering on their phones.

Try it: tap an answer

The training was useful for my work.

  1. Strongly disagree2 · 5%
  2. Disagree4 · 10%
  3. Neither agree nor disagree8 · 20%
  4. Agree16 · 40%
  5. Strongly agree10 · 25%

People: 40Median: AgreeMode: AgreeTop two: 65%

Sample group of 40 people. An illustration with made-up numbers, not survey data.

Run a Likert survey live

Start from the Training feedback presentation: rating scale slides, a poll, a word cloud, open text and a Q&A, all answered on phones. Or build your own in one interactive presentation. People join with a PIN or QR code, no app and no account.

Where a Likert scale helps

Pick a use to jump to ready questions for it.

What is a Likert scale?

A Likert scale asks people how strongly they agree with a statement, or how often, how satisfied, how important or how likely, by picking one of a few ordered answers. It is named after Rensis Likert, an American social psychologist who described the method in 1932 (Archives of Psychology, no. 140).

Strictly, a single statement with its answer choices is a Likert item, and the scale is the total or average over several items. People use “Likert scale” for both, and so does this page. The difference matters when you analyse the answers, because items and scales call for different methods.

Five points or seven?

Five points is the usual choice, and a five-point scale with every answer labelled is easy to read. Seven points give people finer shades to choose from. Research reviewed by Duke’s survey methodology group reports that seven points with a midpoint tend to be the most reliable, and that a middle option is picked more often on a five-point scale than on a seven-point one.

Keep the scale balanced: the same number of positive and negative answers around the middle. The neutral answer is usually worded “Neither agree nor disagree”. Some people who choose it have no opinion rather than a neutral one, so add a separate “Not sure” or “Not applicable” answer when that could be true.

Likert scale examples to copy

Six common label sets, each with a five-point and a seven-point version. Every answer has a label, and the scales are balanced around the middle.

Agreement

When to use it Use it when you give a statement and want to know how far people agree with it.

Agreement, 5-point
#5-point
1Strongly disagree
2Disagree
3Neither agree nor disagree
4Agree
5Strongly agree
Agreement, 7-point
#7-point
1Strongly disagree
2Disagree
3Somewhat disagree
4Neither agree nor disagree
5Somewhat agree
6Agree
7Strongly agree

Frequency

When to use it Use it to find out how often something happens or how often people do something.

Frequency, 5-point
#5-point
1Never
2Rarely
3Sometimes
4Often
5Always
Frequency, 7-point
#7-point
1Never
2Almost never
3Rarely
4Sometimes
5Often
6Almost always
7Always

Satisfaction

When to use it Use it to ask how happy people are with a specific part of an experience.

Satisfaction, 5-point
#5-point
1Very dissatisfied
2Dissatisfied
3Neither satisfied nor dissatisfied
4Satisfied
5Very satisfied
Satisfaction, 7-point
#7-point
1Very dissatisfied
2Dissatisfied
3Somewhat dissatisfied
4Neither satisfied nor dissatisfied
5Somewhat satisfied
6Satisfied
7Very satisfied

Importance

When to use it Use it to learn how much a topic, feature or goal matters to people.

Importance, 5-point
#5-point
1Not at all important
2Slightly important
3Moderately important
4Very important
5Extremely important
Importance, 7-point
#7-point
1Not at all important
2Slightly important
3Somewhat important
4Moderately important
5Quite important
6Very important
7Extremely important

Likelihood

When to use it Use it to ask how likely people are to do something, such as come back or recommend.

Likelihood, 5-point
#5-point
1Very unlikely
2Unlikely
3Neither likely nor unlikely
4Likely
5Very likely
Likelihood, 7-point
#7-point
1Very unlikely
2Unlikely
3Somewhat unlikely
4Neither likely nor unlikely
5Somewhat likely
6Likely
7Very likely

Quality

When to use it Use it to rate how good something was, such as materials, speakers or a session.

Quality, 5-point
#5-point
1Very poor
2Poor
3Fair
4Good
5Excellent
Quality, 7-point
#7-point
1Extremely poor
2Very poor
3Poor
4Fair
5Good
6Very good
7Excellent

Likert scale questions you can use

Each question is one idea in neutral wording, and the label next to it says which scale to answer it on. Copy a group, or pick the ones you need.

Training feedback

After a workshop, course or onboarding session.

  1. The training content was relevant to my role.Scale: Agreement
  2. The trainer explained each topic clearly.Scale: Agreement
  3. I can apply what I learned in my daily work.Scale: Agreement
  4. How would you rate the quality of the training materials?Scale: Quality
  5. How satisfied were you with the pace of the training?Scale: Satisfaction

Employee pulse

A short check-in you can repeat every month or quarter.

  1. I understand what is expected of me in my role.Scale: Agreement
  2. I have the tools I need to do my job well.Scale: Agreement
  3. I feel my work is valued by my team.Scale: Agreement
  4. How often do you receive useful feedback from your manager?Scale: Frequency
  5. How likely are you to recommend this team as a place to work?Scale: Likelihood

Events

After a meetup, conference or party.

  1. The event schedule was easy to follow.Scale: Agreement
  2. The event staff were helpful.Scale: Agreement
  3. Check-in at the event was quick.Scale: Agreement
  4. How satisfied were you with the venue?Scale: Satisfaction
  5. How likely are you to attend this event again?Scale: Likelihood

Classes

For learners aged 13 and over, at the end of a unit.

  1. The lessons were easy to follow.Scale: Agreement
  2. I felt comfortable asking questions in class.Scale: Agreement
  3. The examples helped me understand the topic.Scale: Agreement
  4. How often did the activities help you learn?Scale: Frequency
  5. How satisfied were you with the amount of practice time?Scale: Satisfaction

Meetings

A one-minute check after a recurring meeting.

  1. The meeting had a clear purpose.Scale: Agreement
  2. The meeting ended on time.Scale: Agreement
  3. Everyone had a fair chance to speak.Scale: Agreement
  4. How often do our meetings stay on topic?Scale: Frequency
  5. How important is this meeting to your work?Scale: Importance

How to read Likert scale results

  1. Count the answers for each option and turn them into percentages. A table or a bar chart of the whole distribution shows more than a single number, and a frequency distribution is often more useful than a mean.
  2. Find the median: put every answer in order and take the middle one. It says where the middle of the room sits.
  3. Find the mode: the answer chosen most often.
  4. Add the share of the top two answers, such as Agree and Strongly agree, when you want one headline figure that anyone can read.
  5. Look at the spread. Two groups can share a median and still differ: one agrees, the other is split.

Mean or median: a real debate

Statisticians disagree about averaging Likert answers. One view holds that the answers are ordered categories, so the median or mode is the right summary, and that the average of Agree and Neither is not a label halfway between them. Another view holds that tests which use means hold up well for Likert data, so a mean does not give a wrong answer. Both positions are set out in the sources below.

A practical way through: always show the full distribution. If you also quote an average, say it is the average of the 1 to 5 scores, show the spread next to it, and do not read 3.4 as a label. Compare groups with the same scale and a similar number of answers.

Common mistakes in Likert scale questions

  • Two questions in one. A statement like “The trainer was clear and funny” asks about two things. Split it into two items.
  • Unbalanced answers. Offering three positive answers and one negative one nudges people up the scale. Use equal numbers either side of the middle.
  • Leading wording. Wording such as “Don’t you agree that the training was excellent?” pushes people toward a high rating. State the item neutrally.
  • Every statement worded positively. Some people lean toward agreeing with any statement. Mixing positive and negative statements can help.
  • Too many or unlabelled points. Keep the list short and label every point, so each person reads the same scale the same way.
  • No way out. Forcing an answer from someone with no opinion adds noise. Offer “Not sure” or “Not applicable” where it fits.

Run a Likert scale live in RiLiFi

In a RiLiFi presentation there are two ways to ask a Likert question. The Rating scale slide takes up to 10 statements and asks for a number, 1 to 5 or 1 to 10, with the results shown as bars with the average, a slider or one big average. It uses numbers, so it does not show named answers like “Strongly agree”.

For a labelled scale, use a Poll slide with five options, one for each label. The poll shows the count and share for each answer. Both are slides inside a presentation, and both are on every plan, including Free; the plans differ in saved activities, sessions and room size.

Every session gets a report. Excel, CSV and PDF exports and names in results are on paid plans. The Training feedback presentation has rating scale slides, a poll, a word cloud, open text and a Q&A, so you can run a whole feedback round from one link.

What it looks like

Ratings on the big screen, answers on every phone

A rating scale slide shows the average and the spread for each statement as people answer from their phones.

A RiLiFi rating scale slide: three statements about space travel, each with a small bar chart of answers from 1 to 5 and an average such as 3.7
Rating scale slide
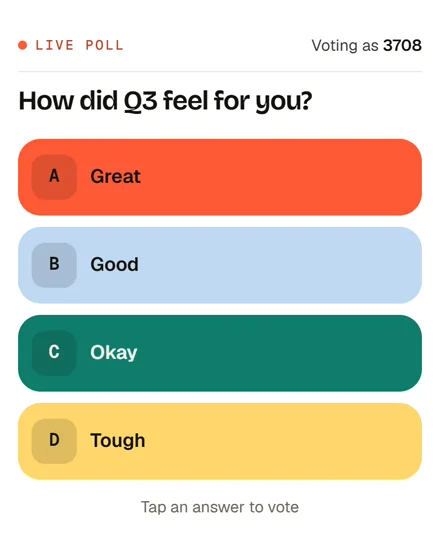
A phone showing a live RiLiFi poll with four labelled answers to tap: Great, Good, Okay and Tough
A labelled poll on a phone

Sources we read

We opened every source below. Each line says what the page supports, so you can check us.

  • Statistics Corner. Questions and answers about language testing statistics: Likert items and scales of measurement?SHIKEN (JALT Testing & Evaluation SIG Newsletter)Brown separates a single Likert item (an item format) from a Likert scale (a total or average over several items), says the ordinal-or-interval argument gets muddled when the two are mixed up, and lists Likert's 1932 paper as Archives of Psychology, 140, 1-55.
  • Analyzing and Interpreting Data From Likert-Type ScalesJournal of Graduate Medical Education (via PubMed Central)The authors lay out both positions: some experts say to use medians for Likert data, others accept parametric tests such as t tests with adequate samples, and they add that a frequency distribution is often more useful than a mean. They describe Likert scales as typically 5- or 7-point, and list Likert's 1932 paper as Archives of Psychology 22(140).
  • Likert scales: how to (ab)use themMedical Education (university-hosted copy of the article)Jamieson argues that Likert response categories are ordinal, so the median or mode and non-parametric tests are the proper choice, and that the average of two labels is not a label halfway between them; she also notes that using means is common practice.
  • Likert scales, levels of measurement and the "laws" of statisticsMcMaster University Experts (record of the article)Norman answers critics who say parametric tests are unsuitable for ordinal Likert data, and concludes from earlier studies that these methods hold up well, so using means and similar statistics will not give a wrong answer.
  • Analyzing Likert DataJournal of ExtensionThe abstract says Likert-type items and Likert scales call for different analysis procedures, and that the article explains the difference and gives advice on descriptive statistics.
  • Tipsheet: Improving Response ScalesDuke Initiative on Survey Methodology (dism.duke.edu)The tipsheet says a middle option invites people to pick it, and more so on a 5-point than a 7-point scale; it reports research that 7 points with a midpoint tend to be most reliable, with 5-point and 3-point scales also common; and it advises pretesting.
  • Towards a Reconsideration of the Use of Agree-Disagree Questions in Measuring Subjective EvaluationsResearch in Social and Administrative Pharmacy (via PubMed Central)This peer-reviewed review found more studies linking agree-disagree questions to acquiescence than not (four found it, four found no or mixed differences), says people often choose the middle option because they have no opinion, and reports that 5 categories is the most common choice, with fully labelled five-point scales possibly best for data quality.
  • Middle Alternatives Revisited: How the neither/nor Response Acts as a Way of Saying "I Don't Know"?Sociological Methods & Research (SAGE)Using follow-up questions, the authors found most people who picked the middle option meant they had no opinion rather than a neutral one, and that moving those answers to don't know changed the results.
  • Writing Survey QuestionsPew Research CenterPew says a question that asks about two things at once is hard to answer and to interpret, so split it; says word choice can shift answers; says agree-disagree statements invite more agreement from some groups; and advises keeping closed-ended lists short, about four or five options.
  • Writing Good Survey Questions: 10 Best PracticesNielsen Norman GroupNN/g gives an example of a double-barrelled question and says to split it, warns that framing or context in a question can push people toward a high rating, and says rating scales should have equal numbers of positive and negative options around a neutral middle.
  • Rating Scales in UX Research: Likert or Semantic Differential?Nielsen Norman GroupNN/g says Likert items typically use five points (seven or nine are possible), include a neutral option worded like neither agree nor disagree, and that mixing positive and negative statements can help counter acquiescence.

Quizzes and interactive slides that go with this tool. Open one to see what’s inside, or use it in RiLiFi and run it live.

FAQ

Questions about the Likert scale

What is a Likert scale?
A Likert scale is a set of statements or questions answered by picking one point on an ordered scale, such as Strongly disagree to Strongly agree. It is named after the psychologist Rensis Likert, who described it in 1932.
What is the difference between a Likert item and a Likert scale?
A single statement with its answer choices is a Likert item. The scale, strictly, is the total or average over several items. Items and scales call for different ways of analysing the answers.
Should I use a 5-point or a 7-point Likert scale?
Five points is the most common and easy to read, and seven points give finer shades. Either works if every point has a label and the scale is balanced around a neutral middle.
How do you analyse Likert scale results?
Start with the count and percentage for each option, then the median and the mode, and add the share of the top two answers. Statisticians disagree about whether to average the answers, so show the full distribution next to any average.
Can I run a Likert scale live on phones?
Yes. A Rating scale slide in a RiLiFi presentation asks for a number from 1 to 5 or 1 to 10, and a Poll slide with five options shows a labelled scale such as Strongly disagree to Strongly agree. People join with a PIN or QR code, and the free plan covers 100 people per session.